U1.15 — Key Features of the Market Research Process
Overview
Dotpoint 15: Key Features of the Market Research Process
Market research is how a business finds out what customers want, what competitors are doing, and what is happening in the market.
The syllabus focuses on two big steps: (1) collecting primary and secondary data, then (2) analysing the data to make decisions.

What is Market Research?
Market research is the process of collecting, recording and analysing data about customers, competitors and the market.
It helps a business make better decisions before spending time or money.
What businesses use it for
- Customer preferences: what people like, dislike, and what would make them buy.
- Pricing decisions: what customers think is “worth it” vs “too expensive”.
- Competition: who the competitors are and what makes them attractive.
- Trends: what’s growing (or fading) in Perth/WA right now.
- Place: where customers are and how they want to buy (in-store, delivery, online booking).
Memory tip: Market research = collect → record → analyse.

1) Collection of Primary and Secondary Data
This is the “information gathering” step. Businesses usually use a mix of primary and secondary data.
Primary data
Primary research is new data collected by the business for its own purpose (fresh and specific).
- Examples: Google Forms survey, quick in-store interviews, observing customer flow, taste tests.
- Best when: you need answers to a specific question (e.g., “Would Scarborough customers pay $16 for this lunch?”).
Secondary data
Secondary research uses existing data collected by others (faster and usually cheaper).
- Examples: ABS data, local council info, industry reports, reviews data, competitor websites.
- Best when: you want market background and trends before you spend money on primary research.
Primary research methods
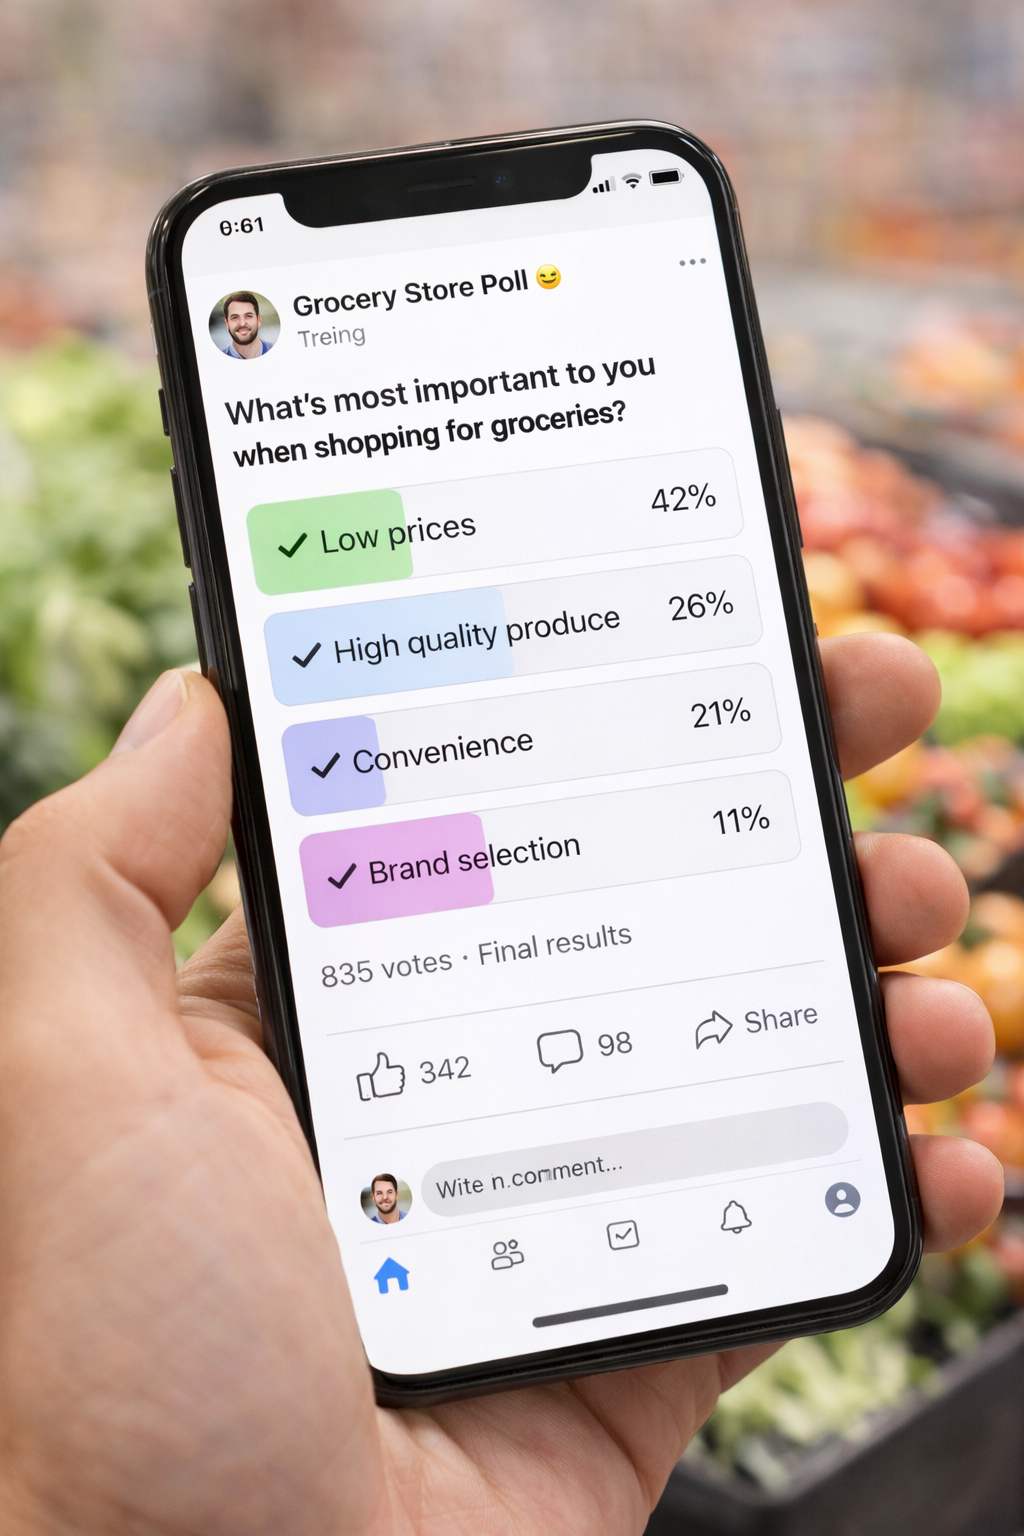
- Surveys: quick data at scale (Google Forms / QR code at the counter / Instagram story polls).
- Interviews: deeper answers (ask “why?” and get detail).
- Observation: watch what people actually do (peak times, queue length, what gets ignored).
- Focus groups: small group discussion (great for ideas and feedback, not perfect for “how many”).
- Experiments: test something and compare results (A/B test two menu boards, two prices, or two ad designs).
Pros and cons
Primary — Pros
- Up to date: you’re collecting it now, in your market.
- Specific: designed to answer your exact question.
- Confidential: competitors don’t automatically get it.
- Control: the business decides exactly what questions are asked.
- Relevance: data directly matches the local market (e.g. Perth customers).
Primary — Cons
- Cost/time: can be slow and expensive.
- Sampling issues: small samples can give misleading results.
- Bias risk: leading questions or “people saying what you want to hear”.
- Low response rates: customers may ignore surveys or rush answers.
- Skill required: poorly designed questions can distort results.


Common secondary sources
- Government + statistics: ABS, WA Government reports, local council data.
- Industry reports: IBISWorld-style reports, trade associations, chambers of commerce.
- Competitor research: menus/prices, promotions, opening hours, Google reviews, social media.
- Internal records: sales history, booking data, loyalty sign-ups, busiest times.
- Online signals: Google Trends, search demand, online booking enquiries.
Pros and cons
Secondary — Pros
- Low cost: often free or cheaper than primary research.
- Time efficient: data already exists and is quick to access.
- Large scale: covers wide populations (e.g. ABS data).
- Trend analysis: useful for spotting long-term patterns.
- Benchmarking: helps compare performance against competitors.
Secondary — Cons
- Not specific: may not perfectly match the business question.
- Outdated: data may no longer reflect current conditions.
- Generic: often broad rather than local (not Perth-specific).
- Quality varies: accuracy depends on who collected it.
- No control: business cannot change how data was gathered.


2) Data Analysis
Collecting data is useless unless you turn it into decisions. Data analysis is where the business looks for patterns, trends and meaning.
Step-by-step
- Record results: put survey answers into a spreadsheet, group interview notes, and write down observation counts.
- Clean the data: remove duplicates, fix obvious mistakes, and check for missing answers that could distort results.
- Summarise: calculate totals, averages and percentages so you can quickly see what the majority thinks.
- Visualise: turn results into simple charts/graphs so patterns stand out straight away.
- Compare groups: split results by segments (e.g., students vs adults, Scarborough vs Trigg) to see differences.
- Decide: link the results back to business decisions (product, price, promotion, place, service improvements).

Quantitative vs Qualitative
Quantitative data is numerical data that can be measured and counted, such as percentages, totals, averages and frequencies.
Qualitative data is descriptive data that explains opinions, reasons and attitudes behind customer behaviour.
Quantitative (numbers)
- What it looks like: percentages, averages, counts.
- Best for: “how many?”, “how often?”, “which option is most popular?”
- Example: 120 survey responses show 48% would pay $12–$15 for lunch.
Qualitative (reasons)
- What it looks like: opinions, explanations, themes.
- Best for: “why do customers think that?”
- Example: interviews reveal customers want faster service and clearer menu options.
WA Example: Market Research in Action
Perth Example — New Lunch Offer in Leederville
A small café in Leederville wants to launch a weekday lunch special to bring in more customers between 11:30am–2pm.
What they collect
- Primary: QR-code survey on tables + short interviews at the counter (“What would make you come back for lunch?”).
- Secondary: competitor lunch prices in Mount Hawthorn/Leederville, Google reviews, and their own sales data (busiest days/times).
How they analyse it
- Segment results: office workers vs students vs locals.
- Price testing: compare “$14 deal” vs “$16 deal” preference.
- Pattern spotting: most demand is Tue–Thu, and customers want quick service + clear bundles.
What decision it leads to
- Create a fast lunch bundle (wrap + drink) priced where the largest group said “yes”.
- Promote it on Google Business Profile and Instagram during Tue–Thu mornings.
- Improve process (pre-prep ingredients) to cut wait time during the peak rush.

🎧 Prefer listening?
If you prefer listening to the content in podcast format:
🎥 Prefer watching?
If you prefer watching the content in video format:
Big retailers use loyalty programs as ongoing market research. With over 10 million active Everyday Rewards members, Woolworths gains constant insights into customer buying behaviour.