
U4.12 — Basic Financial Ratios
Overview
Dotpoint 12: basic financial ratios.
Financial ratios are calculations used to analyse a business’ financial performance and financial position. They help turn financial statement data into results that can be compared, interpreted and used for decision-making.
This dotpoint revisits many of the financial ratios introduced in Year 11 (U2.18), while also introducing two new ratios.
It may also be useful to revisit U2.16 — Purpose and Features of Key Financial Reports to refresh key terms such as assets, liabilities, equity, sales, expenses and profit before interpreting financial ratios.
Students need to understand the purpose of each ratio, identify its key features, and interpret the results using financial data.
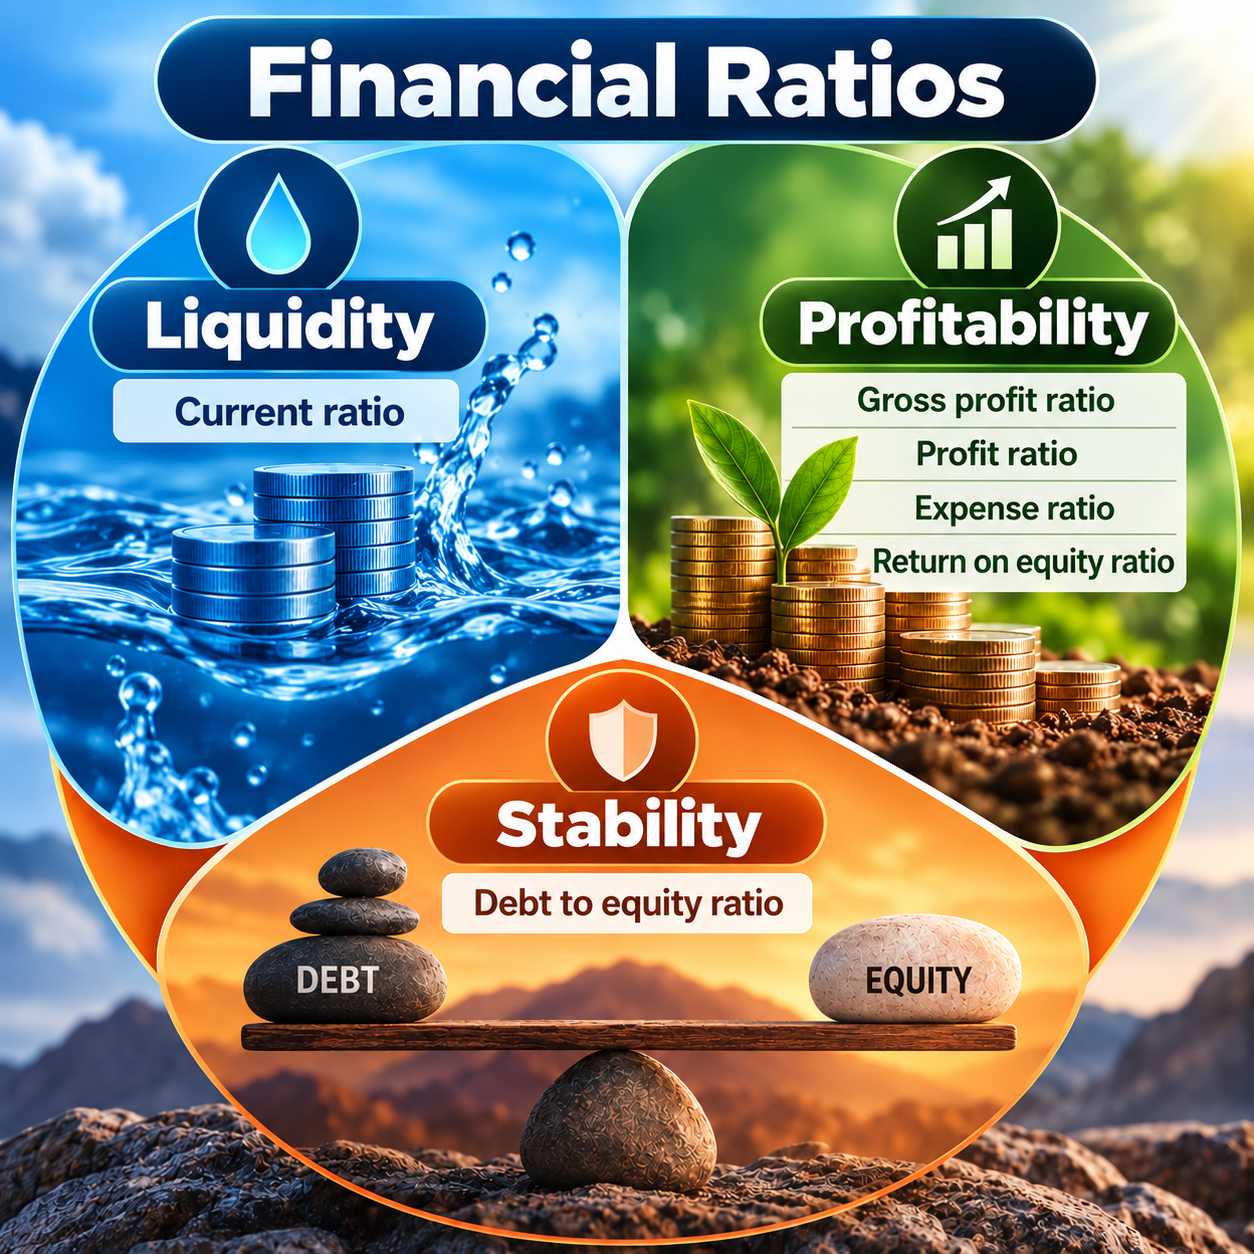
The three categories of basic financial ratios are:
- Liquidity — current ratio
- Profitability — gross profit ratio, profit ratio, expense ratio and return on equity ratio
- Stability — debt to equity ratio
🎯 Financial ratios
The purpose of financial ratios
Financial ratios are calculations used to analyse a business’ financial performance and financial position. They help turn financial statement data into results that can be compared, interpreted and used for decision-making.
The purpose of basic financial ratios is to help a business analyse financial performance and financial position by comparing figures from financial statements.
Ratios make financial information easier to interpret because they turn raw numbers into results that can be compared over time, against competitors or against industry averages.
This helps managers, owners, investors and lenders identify strengths, weaknesses and areas requiring attention.

Why businesses use financial ratios
Financial ratios help a business:
- Compare performance over time: compare this year’s ratios with previous years to see whether performance is improving or declining.
- Compare against others: compare with competitors or industry averages to judge whether performance is strong or weak.
- Identify problems early: highlight issues such as rising expenses, poor liquidity, declining profitability or excessive reliance on debt.
- Support decision-making: help managers decide whether to reduce costs, increase prices, borrow money, delay expansion or change operations.
- Assess risk: show whether a business can meet short-term debts and remain financially stable over the longer term.
- Communicate financial health: explain financial performance clearly to owners, shareholders, lenders and potential investors.
The three financial indicators
Liquidity
Liquidity measures the ability of a business to meet its short-term debts when they fall due.
Main ratio:
- Current ratio
Profitability
Profitability measures the ability of a business to generate profit from sales and from owners’ investment.
Main ratios:
- Gross profit ratio
- Profit ratio
- Expense ratio
- Return on equity ratio
Stability
Stability measures the long-term financial strength of a business and the level of reliance on debt compared with equity.
Main ratio:
- Debt to equity ratio
How to interpret, comment on and assess financial ratios
In Year 12 BME exams, financial ratio questions will often ask you to interpret, comment on or assess the results.
Although the command terms are slightly different, a strong financial ratio response should usually follow the same basic structure:
1. State the result
Use the actual ratio and figures from the data provided.
For example: The profit ratio decreased from 8% to 5%.
Do not simply say that the ratio “went down” or “got worse”. Use the numbers.
2. Compare the result
Compare the ratio with another useful benchmark, such as the previous year, another business, a competitor, the industry average or a target level.
Then identify the direction of the change.
For example: The profit ratio decreased from 8% to 5% and is below the industry average of 7%, meaning profitability is weaker than both the previous year and similar businesses in the industry.
3. Explain what the result means
Translate the ratio into plain business meaning.
Explain what the result suggests about the business’s liquidity, profitability, stability, cost control or overall financial performance.
For example: A lower profit ratio means the business is keeping less profit from each dollar of sales, which may indicate that expenses have increased or that the business is not controlling costs effectively.
This is usually the most important part of the response. Do not stop after describing whether a ratio increased or decreased — explain the business consequence.
4. Judge the result
State whether the result appears to be strong, satisfactory, weak or concerning based on the information provided.
Your judgement should be supported by the comparison rather than simply assuming that a higher or lower number is always better.
5. Identify a possible cause
Where appropriate, explain why the ratio may have changed.
- Lower gross profit may result from higher cost of goods sold.
- A higher expense ratio may result from rising wages, rent or marketing costs.
- A lower current ratio may result from increased short-term borrowing.
- A higher debt to equity ratio may result from taking on additional loans.
Only suggest causes that are reasonable given the information in the question.
6. Suggest a strategy to improve the result
For comment on and especially assess questions, a strong response can go one step further by suggesting a realistic strategy.
The strategy should directly address the problem shown by the ratio.
For example, the business could reduce operating expenses or increase selling prices to improve its profit ratio.
BME Hub shortcut
A strong financial ratio response can be remembered as:
Not every question will require all six steps, but the more demanding the command term, the further you should go.
INTERPRET
Result → Compare → Meaning
COMMENT ON
Result → Compare → Meaning → Judge, with some additional detail
ASSESS
Result → Compare → Meaning → Judge → Cause/Strategy → Overall conclusion
Worked example — interpret compared with comment on and assess
Data: The profit ratio decreased from 8% to 5%, while the industry average is 7%.
Interpret sample answer
The profit ratio decreased from 8% to 5%, meaning the business kept a smaller percentage of sales revenue as profit. It is also below the industry average of 7%, suggesting profitability is weaker than similar businesses in the industry.
Comment on sample answer
The profit ratio decreased from 8% to 5% and is now below the industry average of 7%. This is a weaker result because the business is keeping less profit from each dollar of sales than it did previously and is underperforming compared with similar businesses. This may indicate weaker cost control or pressure on selling prices.
Assess sample answer
The profit ratio decreased from 8% to 5%, meaning the business kept less profit from each dollar of sales. This is a concerning result because it is also below the industry average of 7%, suggesting the business is performing worse than competitors in profitability. A possible cause may be rising operating expenses, weaker sales prices or higher cost of goods sold. The business could improve this result by reviewing expenses, increasing prices where possible or finding cheaper suppliers. Overall, profitability appears weak and requires corrective action.
💧 Liquidity — current ratio
What is liquidity?
Liquidity measures the ability of a business to meet its short-term debts when they fall due.
It focuses on whether the business has enough current assets, such as cash, accounts receivable and inventory, to cover current liabilities, such as supplier payments, wages, tax, overdrafts and short-term loans.
A business can be profitable but still experience cash flow pressure if it does not have enough liquid assets available at the right time. This makes liquidity important for day-to-day survival, supplier confidence and the ability to keep operating without financial disruption.
The liquidity ratio in this syllabus is the current ratio.

Current Ratio
Purpose and features of the current ratio
Purpose
The purpose of the current ratio is to assess the business’s liquidity — its ability to meet short-term debts as they fall due.
It helps managers, owners and lenders judge whether the business has enough short-term assets available to cover its short-term financial obligations.

What it measures
The current ratio measures how many dollars of current assets the business has for every $1 of current liabilities.
For example, a current ratio of 1.5:1 means the business has $1.50 of current assets for every $1 of current liabilities.
Financial statement used
The current ratio uses figures from the balance sheet, specifically:
- current assets — short-term assets the business expects to use, sell or convert into cash within the next 12 months, such as cash, bank balances, inventory and accounts receivable
- current liabilities — short-term debts or obligations the business expects to pay within the next 12 months, such as accounts payable, wages owing, tax payable, overdrafts and short-term loans
Higher or lower?
A higher current ratio generally indicates stronger liquidity, because the business has a greater level of short-term assets available to cover short-term debts.
A low current ratio may indicate liquidity pressure, particularly if the business does not have enough current assets to meet liabilities as they fall due.
However, the ratio should always be compared with previous years, competitors or industry averages before judging whether the result is strong or weak.
Warning
A very high current ratio is not always a positive result.
It may indicate that the business has excessive cash, inventory or other current assets that are not being used productively. This could mean resources are sitting idle rather than being invested in growth or used to generate greater returns.
Therefore, the aim is not simply to achieve the highest possible current ratio, but to maintain a level that provides sufficient liquidity without using resources inefficiently.
How to interpret the current ratio
Above 1:1
The business has more current assets than current liabilities. This usually suggests it can meet short-term debts.
Around 1.5:1 to 2:1
This is often considered a sound position, although the ideal result depends on the industry.
Below 1:1
The business has fewer current assets than current liabilities. This may indicate liquidity pressure or difficulty paying short-term debts.
Why liquidity may weaken
- Current liabilities increase: supplier debts, overdrafts, wages owing or short-term loans rise faster than current assets.
- Cash balances fall: the business uses cash to pay expenses, drawings, tax or short-term debts.
- Current assets fall: inventory is sold, cash is spent or receivables are collected and then used to pay debts.
- Short-term debt increases: replacing long-term finance with short-term borrowing increases current liabilities.
- Quality of current assets weakens: slow-moving stock or delayed receivables may make liquidity weaker than the ratio suggests.
Strategies to improve liquidity
- Collect money owed by customers faster to increase available cash.
- Increase cash sales so the business receives money immediately.
- Reduce short-term debts where possible using available cash or retained profits.
- Sell an unwanted non-current asset, such as old equipment, for cash.
- Replace some short-term debt with a long-term loan so short-term pressure is reduced.
- Improve stock control so less cash is tied up in slow-moving inventory.
Example of how to write this in an exam
Data: The current ratio decreased from 2.0:1 to 1.2:1, while the industry average is 1.6:1.
Interpret
The current ratio decreased from 2.0:1 to 1.2:1, meaning the business has fewer current assets available for every $1 of current liabilities. It is also below the industry average of 1.6:1, suggesting liquidity is weaker than similar businesses in the industry.
Comment on
The current ratio decreased from 2.0:1 to 1.2:1 and is below the industry average of 1.6:1. This is a weaker result because the business now has only $1.20 of current assets for every $1 of current liabilities. Although it still has more current assets than current liabilities, the margin of safety has narrowed, so the business may have less ability to meet short-term debts comfortably.
Assess
The current ratio decreased from 2.0:1 to 1.2:1, showing a weaker liquidity position. This is concerning because the business now has only $1.20 of current assets for every $1 of current liabilities and is below the industry average of 1.6:1. A possible cause may be higher short-term borrowing, increased supplier debts, slower collection of accounts receivable or reduced cash reserves. The business could improve liquidity by collecting accounts receivable more quickly, reducing short-term liabilities, improving inventory control or holding more cash. Overall, liquidity has weakened and should be monitored carefully.
📈 Profitability — four ratios
What is profitability?
Profitability measures the ability of a business to generate profit from its sales, resources and owners’ investment.
It focuses on whether the business can earn enough profit after covering costs such as cost of goods sold, wages, rent, utilities, advertising, insurance and administration expenses.
Profitability is important because a business needs profit to survive, reward owners, attract investors, reinvest in operations, repay debt and fund future growth.
The profitability ratios in this syllabus are the gross profit ratio, profit ratio, expense ratio and return on equity ratio.

🧾 Gross profit ratio
Gross Profit Ratio
Purpose and features of the gross profit ratio
Purpose
The purpose of the gross profit ratio is to assess how effectively the business generates gross profit from sales before operating expenses are deducted.
It helps managers judge whether selling prices and direct costs are being managed effectively.
What it measures
It measures how much gross profit is earned from each dollar of net sales after the direct cost of goods sold has been removed.
For example, a gross profit ratio of 40% means the business earns 40 cents of gross profit from every $1 of net sales.
Financial statement used
The gross profit ratio uses figures from the income statement, specifically:
- gross profit — sales revenue remaining after cost of goods sold has been deducted
- net sales — sales revenue after returns, discounts or allowances have been deducted
Higher or lower?
A higher gross profit ratio is usually stronger because it means the business is keeping a larger share of sales after paying direct production or purchasing costs.
There is no exact universal number, because industries differ. A supermarket may operate with a lower gross profit ratio because it competes on volume and lower prices, while a jewellery or luxury fashion business may have higher margins.
It is best interpreted by comparing with previous years, competitors and the industry average.
Warning
A gross profit ratio can improve while final profitability worsens if operating expenses increase significantly. It should therefore be considered with the profit ratio and expense ratio.
Why the gross profit ratio may weaken
- Cost of goods sold increases and absorbs more sales revenue.
- Supplier prices increase, reducing the margin on each product sold.
- Selling prices are lowered through discounts or promotions.
- Production waste increases, increasing direct production costs.
- The sales mix changes toward lower-margin products.
Strategies to improve the gross profit ratio
- Negotiate lower supplier prices to reduce cost of goods sold.
- Increase selling prices where customers will accept it.
- Reduce waste in production or purchasing.
- Improve inventory control to reduce damaged or obsolete stock.
- Focus on higher-margin products that generate stronger gross profit.
Example of how to write this in an exam
Data: The gross profit ratio decreased from 38% to 32%, while the industry average is 36%.
Interpret
The gross profit ratio decreased from 38% to 32%, meaning the business earned less gross profit from each dollar of net sales. It is also below the industry average of 36%, suggesting weaker margins than similar businesses.
Comment on
The gross profit ratio decreased from 38% to 32% and is below the industry average of 36%. This is a weaker result because the business is keeping a smaller share of sales after direct costs. This may indicate higher cost of goods sold, lower selling prices or heavy discounting.
Assess
The gross profit ratio decreased from 38% to 32%, showing weaker control over direct costs or pricing. This is concerning because the result is below the industry average of 36%, meaning the business is earning less gross profit from each dollar of sales than competitors. A possible cause may be rising supplier costs or discounting to maintain sales. The business could improve this ratio by negotiating lower supplier prices, increasing prices or focusing on higher-margin products. Overall, gross profitability has weakened and requires attention.
💰 Profit ratio
Profit Ratio
Purpose and features of the profit ratio
Purpose
The purpose of the profit ratio is to assess how much final profit the business keeps from its sales after expenses have been deducted.
It helps managers judge overall profitability and whether the business is controlling total costs effectively.
What it measures
It measures the percentage of net sales that becomes profit.
For example, a profit ratio of 8% means the business keeps 8 cents of profit from every $1 of net sales.
Financial statement used
The profit ratio uses figures from the income statement, specifically:
- profit — the final profit remaining after costs and expenses have been deducted
- net sales — sales revenue after returns, discounts or allowances have been deducted
Higher or lower?
A higher profit ratio is generally stronger because it means the business is keeping more profit from each dollar of sales.
There is no exact universal number, because industries differ. A restaurant may have a lower profit ratio because rent, wages and food costs are high, while a software business may have a higher profit ratio if sales are strong and running costs are relatively lower.
It is best interpreted by comparing with previous years, competitors and the industry average.
Warning
A business can increase sales but still have a lower profit ratio if expenses rise faster than revenue.
Why the profit ratio may weaken
- Operating expenses increase and reduce final profit.
- Cost of goods sold increases, reducing the profit left from sales.
- Selling prices are too low to cover total costs effectively.
- Discounting increases, reducing net sales and final profit.
- Sales fall while fixed expenses remain the same.
Strategies to improve the profit ratio
- Reduce unnecessary operating expenses such as rent, utilities or administration costs.
- Increase selling prices where demand allows.
- Negotiate lower supplier costs to improve margins.
- Improve productivity so more output is produced from the same resources.
- Focus on higher-margin products or services that generate stronger profit.
Example of how to write this in an exam
Data: The profit ratio decreased from 8% to 5%, while the industry average is 7%.
Interpret
The profit ratio decreased from 8% to 5%, meaning the business kept a smaller percentage of sales revenue as profit. It is also below the industry average of 7%, suggesting profitability is weaker than similar businesses.
Comment on
The profit ratio decreased from 8% to 5% and is below the industry average of 7%. This is a weaker result because the business is keeping less profit from each dollar of sales. This may indicate weaker cost control, rising expenses or pressure on selling prices.
Assess
The profit ratio decreased from 8% to 5%, showing a weaker profitability position. This is concerning because the business is keeping less profit from sales and is below the industry average of 7%. A possible cause may be rising wages, rent, marketing costs or cost of goods sold. The business could improve this ratio by reducing operating expenses, increasing prices or improving productivity. Overall, profitability has weakened and requires corrective action.
🧮 Expense ratio
Expense Ratio
Purpose and features of the expense ratio
Purpose
The purpose of the expense ratio is to assess how effectively the business controls operating expenses compared with sales.
It helps managers identify whether expenses are becoming too high relative to revenue.
What it measures
It measures the percentage of net sales being used to pay operating expenses, such as wages, rent, advertising, utilities, insurance and administration costs.
For example, an expense ratio of 42% means 42 cents of every $1 of net sales is being used to pay operating expenses.
Financial statement used
The expense ratio uses figures from the income statement, specifically:
- operating expenses — costs involved in running the business, such as wages, rent, advertising and utilities
- net sales — sales revenue after returns, discounts or allowances have been deducted
Higher or lower?
A lower expense ratio is usually stronger because it means expenses are taking up a smaller share of sales revenue.
A higher expense ratio is usually weaker because more revenue is being absorbed by operating expenses, leaving less available as profit.
There is no universal “good” expense ratio. It depends on the industry, business type and whether the business is growing or established, so it should be compared with past results, competitors or the industry average.
Why the expense ratio may weaken
- Operating expenses increase faster than net sales.
- Wages, rent, utilities or insurance costs rise, increasing overheads.
- Advertising and marketing costs increase without a matching rise in sales.
- Sales fall while fixed expenses stay the same.
- Expansion increases overheads before revenue grows enough to cover them.
Strategies to improve the expense ratio
- Review and reduce unnecessary expenses that do not increase sales.
- Improve staff productivity so wages produce more output.
- Renegotiate rent, supplier or service contracts to reduce overheads.
- Use technology to reduce administration or labour costs.
- Increase net sales without increasing expenses at the same rate.
Example of how to write this in an exam
Data: The expense ratio increased from 28% to 42%, while the industry average is 33%.
Interpret
The expense ratio increased from 28% to 42%, meaning operating expenses used up a larger percentage of sales revenue. It is also above the industry average of 33%, suggesting weaker cost control than similar businesses.
Comment on
The expense ratio increased from 28% to 42% and is above the industry average of 33%. This is a weaker result because more sales revenue is being absorbed by expenses. This may reduce final profit and place pressure on the business’s profitability.
Assess
The expense ratio increased from 28% to 42%, showing weaker cost control. This is concerning because operating expenses now take up a much larger share of net sales and are above the industry average of 33%. A possible cause may be rising wages, rent, advertising or delivery costs. The business could improve the ratio by reducing unnecessary expenses, improving productivity or increasing sales without increasing costs at the same rate. Overall, the expense ratio is weak and is likely damaging profitability.
👥 Return on equity ratio
Return on Equity Ratio
Purpose and features of the return on equity ratio
Purpose
The purpose of the return on equity ratio is to assess how effectively the business uses owners’ investment to generate profit.
It helps owners and investors judge whether their funds are producing a worthwhile return.
What it measures
It measures the return owners receive from the equity invested in the business.
For example, a return on equity ratio of 11% means the business earns 11 cents of profit for every $1 of owners’ equity.
Financial statement used
The return on equity ratio uses figures from both financial statements:
- profit — from the income statement
- equity at end — from the balance sheet, showing the owners’ interest in the business at the end of the period
Higher or lower?
A higher return on equity ratio is generally stronger because it means owners’ funds are being used more effectively to generate profit.
Ideally, the return should be higher than what owners could earn from a low-risk investment, such as bank interest, because business ownership involves greater risk.
However, there is no universal benchmark, so it should also be compared with past performance, competitors or the industry average.
Warning
A higher return on equity should still be considered alongside stability and liquidity because strong returns may be supported by higher risk or increased debt.
Why return on equity may weaken
- Profit decreases, reducing the return earned for owners.
- Expenses increase faster than sales, reducing final profit.
- Sales revenue weakens, making it harder to generate profit.
- Owners invest more equity but profit does not rise enough to match it.
- Resources are not used efficiently, reducing profit from the equity invested.
Strategies to improve return on equity
- Increase profit through stronger sales, pricing or margins.
- Reduce expenses to improve final profit.
- Improve productivity so resources generate more profit.
- Focus on higher-margin products or services.
- Review how owners’ funds are being used to reduce unproductive investment.
Example of how to write this in an exam
Data: The return on equity ratio increased from 8% to 11%, while the industry average is 9%.
Interpret
The return on equity ratio increased from 8% to 11%, meaning the business generated a higher return for owners from the equity invested. It is also above the industry average of 9%, suggesting owners’ funds are being used more effectively than similar businesses.
Comment on
The return on equity ratio increased from 8% to 11% and is above the industry average of 9%. This is a stronger result because owners received a better return on their investment and the business is outperforming similar businesses on this measure. It may also be more attractive than a low-risk return, such as bank interest, which is important because owners take on greater risk by investing in the business.
Assess
The return on equity ratio increased from 8% to 11%, showing improved returns for owners. This is a positive profitability result because the business is generating more profit from equity and is above the industry average of 9%. A possible cause may be higher sales, better cost control or improved efficiency. To improve the ratio further, the business could increase profit by reducing expenses, improving pricing, focusing on higher-margin products or using owners’ equity more productively. Overall, return on equity has improved and suggests stronger use of owners’ funds.
🏦 Stability — debt to equity ratio
What is stability?
Stability measures the long-term financial strength of a business. It shows whether the business is relying heavily on debt or whether it has a safer balance between liabilities and equity.
It focuses on the business’s ability to survive over the longer term, manage its financial commitments and avoid becoming too dependent on borrowed funds.
Stability is important because a business with too much debt may struggle to make repayments, cover interest costs or borrow more funds in the future. This can increase financial risk, especially if sales fall or interest rates rise.
The stability ratio in this syllabus is the debt to equity ratio.
Debt to Equity Ratio
Purpose and features of the debt to equity ratio
Purpose
The purpose of the debt to equity ratio is to assess the long-term financial stability of a business by comparing the level of debt funding with owner funding.
It helps managers, owners and lenders judge whether the business is relying too heavily on borrowed funds.
What it measures
It measures the relationship between the funds provided by creditors and the funds provided by owners.
For example, a debt to equity ratio of 60% means the business has 60 cents of liabilities for every $1 of equity.
Financial statement used
It uses figures from the balance sheet, specifically:
- total liabilities — all debts and obligations owed by the business, including short-term and long-term liabilities
- total equity — the owners’ interest in the business, including contributed capital and retained profits
Higher or lower?
A lower debt to equity ratio is usually safer because it shows the business is less reliant on borrowed funds.
A higher debt to equity ratio can indicate weaker stability because the business relies more heavily on liabilities, increasing risk for lenders and owners.
However, there is no universal “perfect” percentage. The result should be judged against previous years, competitors and the industry average.
Warning
Some debt can be useful if it helps the business grow profitably. However, excessive debt can increase repayments, interest costs and financial pressure.
How to interpret debt to equity
Lower debt to equity
A lower result, such as below 50%, usually indicates stronger stability because the business is less reliant on debt and may face lower financial risk.
Moderate debt to equity
A result around 100% suggests a more balanced mix of debt and equity. However, the business still needs to ensure it can comfortably meet repayments and manage its debt obligations.
Higher debt to equity
A result above 150% indicates greater reliance on debt and usually weaker stability because financial risk is higher.
A result above 200% may be considered particularly risky, although acceptable levels can vary between industries.
Why debt to equity may weaken
- Total liabilities increase because the business takes out additional loans.
- Debt is used to fund expansion, increasing repayment and interest obligations.
- Equity falls because losses reduce retained profits.
- Liabilities rise faster than equity, increasing reliance on creditors.
- Profitability weakens, reducing the ability to build retained profits and owner equity.
Strategies to improve debt to equity
- Use retained profits to repay debt and reduce liabilities.
- Increase equity through owner investment or share capital.
- Improve profitability so retained profits and equity can grow.
- Reduce reliance on loans when funding expansion.
- Sell underused assets and use the cash to reduce liabilities.
Example of how to write this in an exam
Data: The debt to equity ratio increased from 55% to 70%, while the industry average is 60%.
Interpret
The debt to equity ratio increased from 55% to 70%, meaning the business has become more reliant on debt compared with equity. It is also above the industry average of 60%, suggesting weaker stability than similar businesses.
Comment on
The debt to equity ratio increased from 55% to 70% and is above the industry average of 60%. This is a weaker result because the business is relying more heavily on liabilities, which may increase repayments, interest costs and financial risk.
Assess
The debt to equity ratio increased from 55% to 70%, indicating weaker stability. This is concerning because the business is above the industry average of 60%, suggesting it is more reliant on debt than similar businesses. A possible cause may be taking out additional loans to finance expansion. The business could improve stability by using retained profits to reduce debt, increasing equity funding or delaying further borrowing. Overall, stability has weakened and the business may face higher long-term financial risk.
🎧 Prefer listening?
If you prefer listening to the content in podcast format:
🎥 Prefer watching?
If you prefer watching the content in video format:
🃏 Flashcards
Card 1 of 33
🎮 Revision Games
💰 BME Millionaire
Climb the prize ladder. Use your lifelines wisely.
👔 Business Boss
Make 10 real management decisions. Every choice changes your KPIs — sometimes for better and worse.
⚡ 60 Second Showdown
A fast-paced 60-second challenge testing key BME knowledge under pressure.

Biz Fact: There is no single ‘good’ financial ratio because acceptable results vary significantly between industries.
Past Exam Questions
Use these past exam questions to see how this dotpoint has been assessed. Pay close attention to the command term, the number of marks and whether the question is Section 1 or Section 2.
Section 1 Questions
2018 — Section 1 — Question 6(a), 6(b), 6(c) — 10 marks
Context
Jay has just concluded a second year of trading as Jay’s Bike Clinic, a bicycle service and repair business, located in a Perth suburb. He has collected two years of financial data but is unsure as to how to understand his business’ performance and determine whether there is an opportunity for growth.
Questions:
6(a) Define the purpose of basic financial ratios for Jay. (2 marks)
6(b) Name and describe the financial ratio Jay would use to measure the stability of his business. (2 marks)
6(c) Interpret the results of Jay’s Bike Clinic’s financial ratios from the past two years, as shown in the table below. (6 marks)
| Ratios | 2016 | 2017 |
|---|---|---|
| Profit ratio | 11% | 9% |
| Return on equity ratio | 3% | 4.2% |
| Fees income | $106,000 | $132,000 |
| Expenses | $76,500 | $106,000 |
| Current assets | $55,000 | $62,000 |
| Current liabilities | $36,000 | $42,000 |
Command term focus
Define: give the precise meaning. Name and describe: identify the ratio and give its main features. Interpret: state the result, compare it and explain what it means.
See the full command term guide here: Command Terms.
6(a) / 6(b) / 6(c) Sample answers
6(a) The purpose of basic financial ratios is to help Jay analyse and interpret his financial performance and financial position. Ratios allow Jay to compare results between 2016 and 2017 and identify whether his business is improving, declining or needs corrective action.
6(b) The stability ratio Jay would use is the debt to equity ratio. This measures long-term financial stability by comparing total liabilities with total equity, showing how heavily the business relies on debt compared with owners’ funds.
6(c) Jay’s profit ratio decreased from 11% in 2016 to 9% in 2017, which suggests profitability weakened because the business kept less profit from each dollar of fees income. Although fees income increased from $106,000 to $132,000, expenses also increased from $76,500 to $106,000. This means expenses rose faster than income, which is a likely cause of the weaker profit ratio. Jay may need to control wages, rent, materials or other operating expenses to improve profitability.
Jay’s return on equity ratio increased from 3% to 4.2%, meaning the business generated a stronger return for the owner’s investment in 2017. This is a positive sign because equity was being used more effectively to generate profit, even though the overall profit ratio declined.
Jay’s liquidity appears reasonable because current assets increased from $55,000 to $62,000 and current liabilities increased from $36,000 to $42,000. The current ratio was approximately 1.53:1 in 2016 and 1.48:1 in 2017. This means Jay still had enough current assets to cover current liabilities, although liquidity declined slightly and should be monitored.
2019 — Section 1 — Question 6(a), 6(b), 6(c) — 10 marks
Context
Throwngames Ltd manufactures clothing for basketball, baseball and netball. The company has been in operation for 15 years, of which the past five years have been profitable. The Chief Executive Officer of Throwngames Ltd attributes the success of the company to the thorough analysis of its financial information at the end of the financial year, because this allows the finance team to identify areas in need of attention.
Below are the profitability ratios for Throwngames Ltd for the end of the 2018 and 2019 financial years.
| Ratio | 2018 | 2019 |
|---|---|---|
| Gross profit | 9.5% | 12% |
| Profit | 6% | 4% |
| Expense | 3% | 5% |
| Return on equity | 4.5% | 3.5% |
Questions:
6(a) Comment on the return on equity ratio from 2018 to 2019. (2 marks)
6(b) Outline the purpose of the expense ratio and describe one possible reason for the change in this ratio from 2018 to 2019. (4 marks)
6(c) Distinguish between the gross profit ratio and the profit ratio and explain how one can increase while the other decreases. (4 marks)
Command term focus
Comment: use the result, comparison and meaning to make a supported observation. Outline: state the main point and briefly clarify it. Distinguish: make the differences clear.
See the full command term guide here: Command Terms.
6(a) / 6(b) / 6(c) Sample answers
6(a) The return on equity ratio decreased from 4.5% in 2018 to 3.5% in 2019. This suggests Throwngames Ltd generated a lower return for owners from the equity invested in the business, meaning owners’ funds were used less effectively to generate profit in 2019. This is a weaker result for owners and may make the business less attractive to investors if the decline continues.
6(b) The purpose of the expense ratio is to measure operating expenses as a percentage of net sales. Throwngames Ltd’s expense ratio increased from 3% to 5%, which means operating expenses used up a larger share of sales revenue in 2019. One possible reason is that wages, rent, advertising, utilities or distribution costs may have increased, reducing the amount of sales revenue left as final profit.
6(c) The gross profit ratio measures gross profit as a percentage of net sales, focusing on the profit made after direct costs such as cost of goods sold. The profit ratio measures final profit as a percentage of net sales after operating expenses have also been paid.
One can increase while the other decreases if the business improves its gross margin but experiences higher operating expenses. For example, Throwngames Ltd’s gross profit ratio increased from 9.5% to 12%, suggesting stronger margins on clothing sales, but its profit ratio decreased from 6% to 4%. This could occur because expenses increased from 3% to 5%, reducing final profit despite the stronger gross profit result.
2021 — Section 1 — Question 5(a), 5(b) — 10 marks
Context
Financial ratios provide businesses with valuable information about their performance.
5(a): Describe the purpose of the following financial ratios. (4 marks)
Current ratio:
Debt to equity ratio:
5(b): Zwenda’s Kitchen is a popular food franchise across Australia. The franchise has been in operation for 10 years, of which the past nine years have been profitable. Management is concerned about the current economic environment and the decline in customers across the restaurants.
Use the information in the table below to interpret the profit ratio and the expense ratio for the management of Zwenda’s Kitchen. (6 marks)
| Ratio | 2020 | 2021 | Industry average 2021 |
|---|---|---|---|
| Profit ratio | 22% | 16% | 20% |
| Expense ratio | 28% | 42% | 33% |
Command term focus
Describe: give the main characteristics or features. Interpret: state the result, compare it and explain what it means.
See the full command term guide here: Command Terms.
5(a) / 5(b) Sample answers
5(a) Current ratio: The current ratio measures liquidity, which is the ability of a business to meet its short-term debts. It compares current assets with current liabilities and helps show whether the business has enough short-term assets to pay short-term obligations.
5(a) Debt to equity ratio: The debt to equity ratio measures stability, which is the long-term financial strength of the business. It compares total liabilities with total equity and shows how heavily the business relies on borrowed funds compared with owners’ investment.
5(b) Profit ratio: Zwenda’s Kitchen’s profit ratio decreased from 22% in 2020 to 16% in 2021. This means the business kept a smaller percentage of sales revenue as profit in 2021. It is also below the 2021 industry average of 20%, suggesting Zwenda’s Kitchen is less profitable than competitors or similar businesses in the industry. This is a concerning result because the decline in customers across restaurants may be reducing sales while fixed costs remain high.
5(b) Expense ratio: Zwenda’s Kitchen’s expense ratio increased from 28% in 2020 to 42% in 2021. This means operating expenses used up a larger percentage of sales revenue. It is also above the 2021 industry average of 33%, suggesting Zwenda’s Kitchen has weaker cost control than the industry average. Management may need to reduce expenses, improve productivity or increase sales revenue to improve profitability.
2023 — Section 1 — Question 5(a), 5(b), 5(c) — 11 marks
Context
Ratio analysis is important to businesses’ understanding of financial statements and is crucial to stakeholders in comparing past performance.
| Ratio | Company A | Company B |
|---|---|---|
| Debt to equity | 64% | 95% |
| Profit | 12% | 15% |
| Current | 180% | 80% |
| Return on equity | 10% | 12% |
Questions:
5(a) Outline the purpose of basic financial ratios. (2 marks)
5(b) With specific reference to the relevant ratio(s) and data provided, assess the performance of each company in relation to its liquidity and stability. (6 marks)
5(c) From the results in the table, identify which company is more profitable. Justify your answer. (3 marks)
Command term focus
Outline: state the main point and briefly clarify it. Assess: make a supported judgement and conclude. Justify: make a claim and support it with balanced reasons or evidence.
See the full command term guide here: Command Terms.
5(a) / 5(b) / 5(c) Sample answers
5(a) The purpose of basic financial ratios is to help stakeholders analyse financial performance and financial position. Ratios make it easier to compare businesses, identify strengths and weaknesses, and make informed decisions.
5(b) Liquidity: Company A has stronger liquidity because its current ratio is 180%, compared with Company B at only 80%. This means Company A has $1.80 of current assets for every $1 of current liabilities, while Company B has only $0.80 of current assets for every $1 of current liabilities. Company B’s current ratio is below 100%, meaning it has fewer current assets than current liabilities and may struggle to meet short-term debts as they fall due. Therefore, Company A performs better in liquidity, while Company B may need to improve cash flow or reduce current liabilities.
5(b) Stability: Company A also has stronger stability because its debt to equity ratio is 64%, compared with Company B at 95%. Company B is more reliant on debt, which increases financial risk and may make it harder to manage repayments or borrow further funds. Company A’s lower debt to equity ratio suggests it has lower long-term financial risk. Therefore, Company A performs better overall in relation to liquidity and stability because it has a stronger ability to meet short-term debts and lower reliance on debt.
5(c) Company B is more profitable. Its profit ratio is 15% compared with Company A at 12%, meaning Company B keeps a greater percentage of sales as profit. Company B also has a higher return on equity ratio of 12% compared with Company A at 10%, meaning it generates a stronger return for owners from their investment.
2025 — Section 1 — Question 6(a), 6(b) — 9 marks
Context
Sofie has been operating her dance studio, Perth Pirouettes, for the past two years. She is hoping to understand her business’ performance and has gathered financial data since launching the business in 2023.
Questions:
6(a) Identify and describe the financial ratio that Sofie will need to use if she wishes to analyse her business’ liquidity. (3 marks)
Ratio:
Description:
6(b) Comment on the financial ratios of Perth Pirouettes in 2023 and 2024 as shown in the table below. (6 marks)
| Financial ratios | 2023 | 2024 |
|---|---|---|
| Return on equity | 1.5% | 1.8% |
| Debt to equity | 22% | 25% |
Command term focus
Identify: name the required ratio only. Describe: give its main characteristics or features. Comment: use the figures, compare them and explain what they show.
See the full command term guide here: Command Terms.
6(a) / 6(b) Sample answers
6(a) Ratio: Current ratio.
6(a) Description: The current ratio measures liquidity, which is the ability of Perth Pirouettes to meet its short-term debts when they fall due. It compares current assets with current liabilities.
6(b) Return on equity: Perth Pirouettes’ return on equity increased from 1.5% in 2023 to 1.8% in 2024. This suggests profitability improved slightly because the business generated a higher return for the owner’s equity. However, the return remains low, so Sofie may still need to improve sales, pricing or cost control to generate a stronger return from the money invested in the dance studio.
6(b) Debt to equity: The debt to equity ratio increased from 22% in 2023 to 25% in 2024. This means Perth Pirouettes became slightly more reliant on debt compared with equity. Although this is only a small increase and the level of debt still appears relatively low, Sofie should monitor it because rising debt can increase long-term financial risk and reduce stability if repayments become harder to manage.
Section 2 Questions
2016 — Section 2 — Question 8(b), 8(c), 8(d), 8(e) — 20 marks
Case study / context
Bill Brick, Chief Executive Officer (CEO) of a national home renovation company, has proposed to the board of directors that the company outsource the human resource (HR) management function of the business. This part of the company’s strategic plan will allow it to concentrate on the core business of home renovations. After months of researching and interviewing potential outsourcing companies, the company has shortlisted two finalists. However, the board is concerned about the finalists’ financial stability over the longer term.
Summary of 2015 financial ratios for shortlisted HR companies
| Financial ratios | Company A | Company B |
|---|---|---|
| Current ratio | 1.25:1 | 2.0:1 |
| Profit ratio | 10.0% | 13.3% |
| Expense ratio | 65% | 67% |
| Return on equity ratio | 8% | 10% |
| Debt to equity ratio | 50% | 62% |
Questions:
8(b) Explain the purpose of using basic financial ratios. (4 marks)
8(c) Comment on the three categories of basic financial ratios: liquidity, profitability and stability. (6 marks)
8(d) Interpret the three profitability ratios for each company in the table above. (6 marks)
8(e) Recommend the most suitable outsourcing company for HR, based on that company’s ability to manage its short-term debts. (4 marks)
Command term focus
Explain: show cause and effect by explaining why or how and the result. Comment: make a supported observation. Interpret: state, compare and explain the data. Recommend: make a clear choice and explain why.
See the full command term guide here: Command Terms.
8(b) / 8(c) / 8(d) / 8(e) Sample answers
8(b) The purpose of using basic financial ratios is to help Bill Brick and the board analyse the financial performance and financial position of the shortlisted HR companies. Ratios allow the board to compare Company A and Company B more clearly than by looking at raw financial figures alone. This is important because the board is considering outsourcing the HR management function and needs to choose a business that is profitable, liquid and financially stable. As a result, ratio analysis can reduce the risk of choosing an outsourcing provider that may struggle financially over the longer term.
8(c) Liquidity: Liquidity measures the ability of a business to meet its short-term debts. In this case, the current ratio is relevant because the board wants an HR outsourcing provider that can pay short-term liabilities and continue operating reliably.
8(c) Profitability: Profitability measures the ability of a business to generate profit. Profitability ratios are important because a more profitable HR company may be better able to reinvest, maintain service quality and remain viable.
8(c) Stability: Stability measures the long-term financial strength of a business. The debt to equity ratio is relevant because a company relying too heavily on debt may face greater financial risk over the longer term.
8(d) Profit ratio: Company B has a stronger profit ratio of 13.3% compared with Company A at 10.0%. This means Company B keeps a larger percentage of sales as profit, suggesting stronger overall profitability.
8(d) Expense ratio: Company A has a slightly better expense ratio of 65% compared with Company B at 67%. This means Company A’s operating expenses use up a smaller percentage of sales, suggesting slightly stronger expense control. However, the difference is only small, so this alone does not make Company A the stronger financial option.
8(d) Return on equity: Company B has a stronger return on equity ratio of 10% compared with Company A at 8%. This means Company B generates a higher return for owners from equity invested in the business.
8(e) Recommendation: Based on the ability to manage short-term debts, Company B is the most suitable outsourcing company because its current ratio is 2.0:1, compared with Company A at only 1.25:1. This means Company B has $2 of current assets for every $1 of current liabilities, giving it a stronger ability to meet short-term debts. As a result, Company B is less likely to experience short-term liquidity problems that could disrupt the HR services provided to Bill Brick’s company.
2024 — Section 2 — Question 9(c) — 9 marks
Case study / context
Crafted Haven Furniture (CHF) is an iconic furniture business, based in Albany, Western Australia, which specialises in creating custom furniture. The business takes pride in manufacturing unique pieces that are innovatively designed and produced with great attention to detail and expert craftsmanship.
Since 2015, CHF has grown in popularity and now sells to customers around Australia with display showrooms in each of the major cities. Over the past five years, CHF’s exceptional furniture designs have also sparked growing interest internationally, prompting owners May and Sun to think about opening their first overseas store. They are considering initially expanding into Indonesia.
CHF would like to set up a manufacturing base in Indonesia, as well as two stores in the country. The business prioritises ethical production methods and is renowned for leading environmental sustainability in Australia.
| Financial ratios | 2022 | 2023 |
|---|---|---|
| Current ratio | 125% | 175% |
| Debt to equity ratio | 55% | 60% |
| Profit ratio | 12% | 14% |
| Return on equity ratio | 8% | 11% |
| Expense ratio | 60% | 55% |
9(c): Comment on the profitability of CHF in 2022 and 2023, using three suitable ratios from the table above. (9 marks)
Command term focus: Comment
Comment: use the ratio data, compare the results and explain what the changes show about profitability.
See the full command term guide here: Command Terms.
9(c) Sample answer
9(c) Profit ratio: CHF’s profit ratio improved from 12% in 2022 to 14% in 2023. This means CHF kept a larger percentage of sales revenue as profit in 2023. This suggests the business became more profitable, which is positive because CHF may need strong profits to help fund its proposed expansion into Indonesia.
9(c) Return on equity ratio: CHF’s return on equity ratio increased from 8% to 11%. This means the business generated a higher return for May and Sun from the equity invested in the business. This indicates profitability improved because owners’ funds were being used more effectively to generate profit.
9(c) Expense ratio: CHF’s expense ratio decreased from 60% to 55%. This is a positive profitability result because operating expenses used up a smaller percentage of sales revenue in 2023. Better expense control is a likely reason why CHF’s profit ratio and return on equity improved.
Overall, CHF’s profitability improved between 2022 and 2023 because its profit ratio and return on equity increased while its expense ratio decreased. This suggests CHF is in a stronger financial position to consider expansion, although it would still need to assess other factors such as liquidity, stability and the risks of expanding into Indonesia.