U2.18 — Characteristics of Financial Indicators
Overview
Dotpoint 18: characteristics of the following financial indicators.
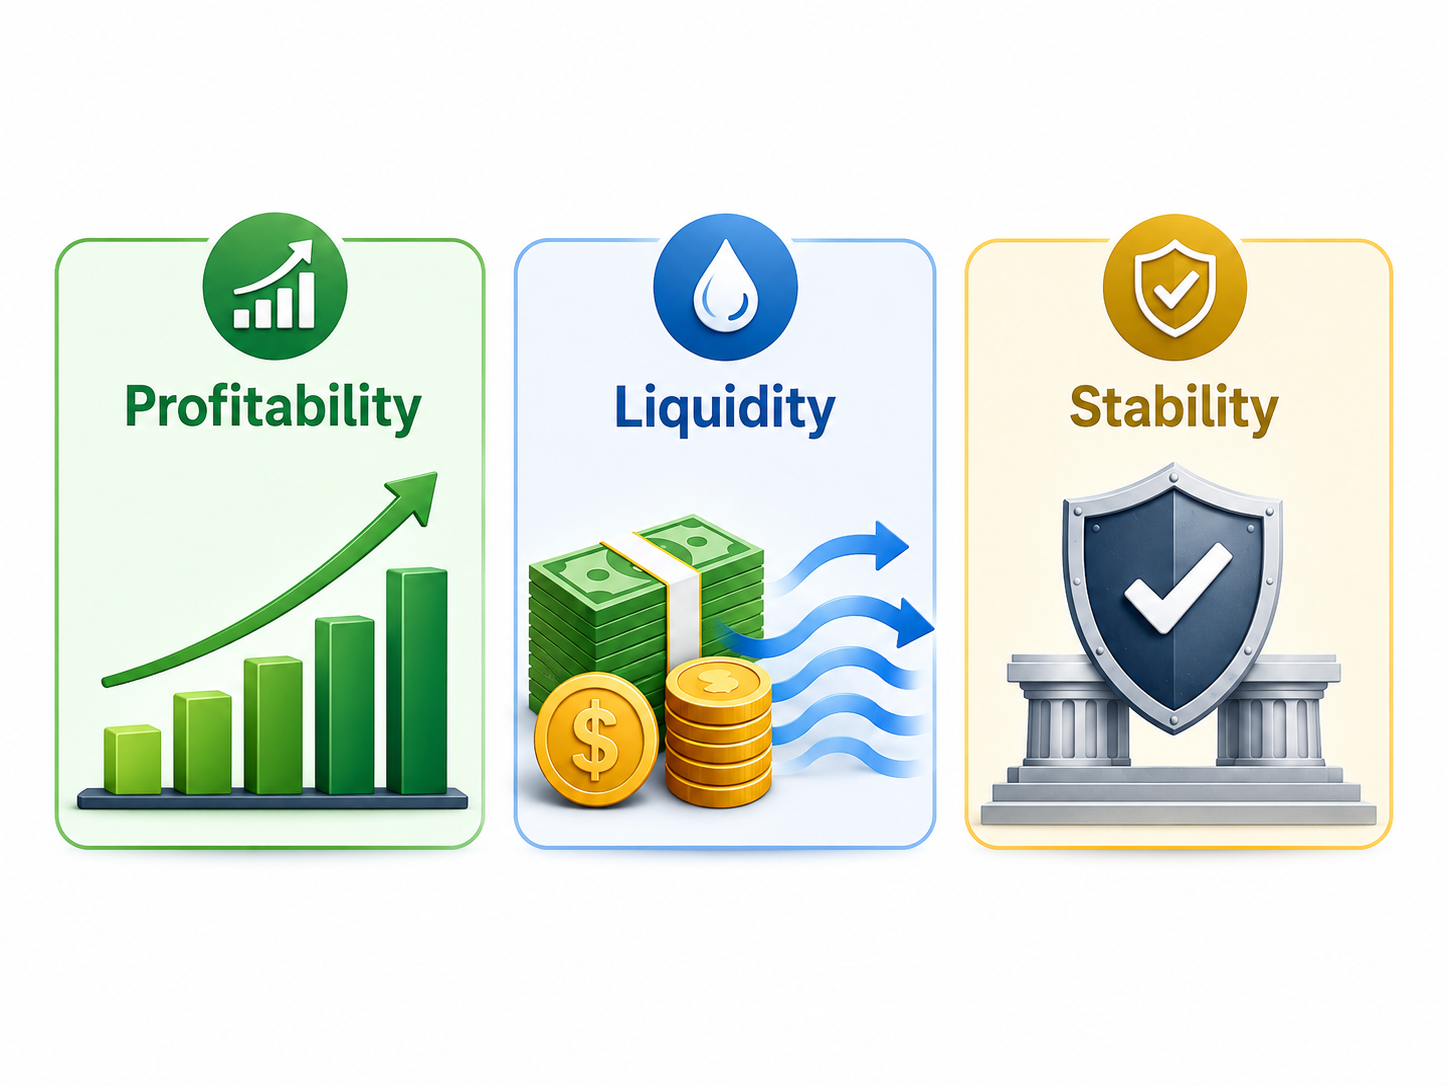
Financial indicators are measures used to judge the financial performance and financial position of a business. In this dotpoint, the focus is on profitability, liquidity and stability.
These indicators are often measured using financial ratios. Ratios help turn raw financial data into something easier to compare, interpret and evaluate.
- profitability — ability to make profit
- liquidity — ability to meet short-term debts
- stability — long-term financial strength
💰 Profitability
Profitability shows how successful a business is at turning sales into profit. It helps answer the question: is the business making enough profit from what it sells?
Why profitability matters
- shows whether the business is making a worthwhile return from its sales
- helps managers judge whether pricing, cost control and efficiency are strong enough
- is important to owners, shareholders, investors and lenders because profit helps support growth and survival
- can reveal whether the business is improving or weakening over time
- helps the business decide whether changes are needed to price, costs, promotion or operations
Financial ratios
Financial ratios are calculations that use figures from financial statements to help measure performance more clearly.
There are many different ratios, but in this course the main ones are:
- profitability ratios — gross profit ratio and net profit ratio
- liquidity ratio — current ratio
- stability ratio — debt to equity ratio

Profitability ratios
Profitability ratios help show how well a business turns sales into profit. In this course, the two main profitability ratios are the gross profit ratio and the net profit ratio.
The main financial statement needed for profitability ratios is the profit and loss statement.
Gross Profit Ratio
Net Profit Ratio
Gross profit ratio
This measures how much gross profit the business earns from each dollar of sales.
It is usually expressed as a percentage.
A higher gross profit ratio usually suggests the business is controlling the direct cost of buying or producing goods well.
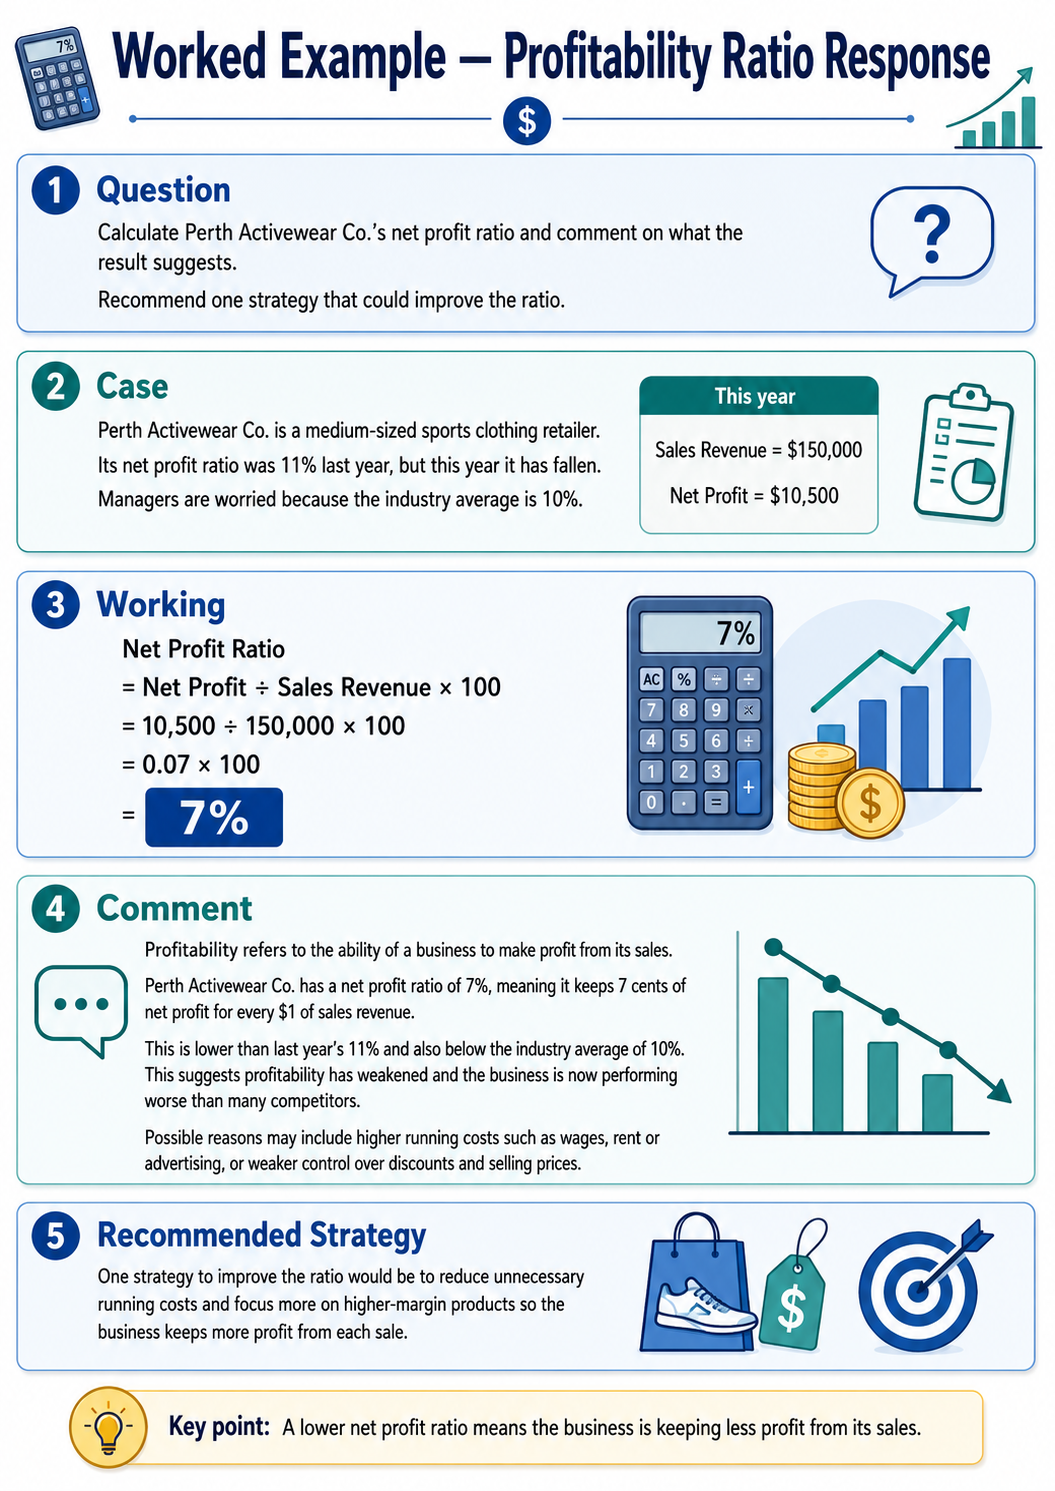
Net profit ratio
This measures how much final profit the business keeps from each dollar of sales after all expenses are paid.
It is usually expressed as a percentage.
A higher net profit ratio usually suggests the business is managing all of its costs more effectively.
How to interpret gross profit ratio
- usually, higher is better
- there is no exact universal number, because industries differ
- a supermarket may have a lower gross profit ratio because it competes on volume and lower prices
- a jewellery or luxury fashion business may have a much higher gross profit ratio because margins are larger
- best interpreted by comparing with previous years, competitors and the industry average
How to interpret net profit ratio
- usually, higher is better
- there is no exact universal number, because industries differ
- a restaurant may have a lower net profit ratio because rent, wages and food costs are high
- a software business may have a higher net profit ratio if sales are strong and running costs are relatively lower
- best interpreted by comparing with previous years, competitors and the industry average
Strategies to improve gross profit ratio
- increase the selling price if customers are still willing to buy
- buy stock at a lower price by negotiating with suppliers
- reduce wastage, spoilage or theft so fewer goods are lost
- focus on selling products with stronger profit margins
- reduce discounting and heavy price cuts if they are hurting gross profit
- improve stock management so the business is not over-ordering or wasting inventory
Strategies to improve net profit ratio
- increase sales revenue through better promotion, stronger customer service or repeat business
- reduce rent, electricity, insurance or other running costs where possible
- reduce wages costs by improving staff efficiency, not by simply cutting staff blindly
- reduce unnecessary advertising spend that is not leading to sales
- reduce product returns, complaints and poor service, because these create extra costs
- tighten control over all costs of running the business, not just stock costs
💧 Liquidity
Liquidity shows whether a business can meet its short-term debts when they fall due. It focuses on the short-term financial position of the business.
Why liquidity matters
- a business can be profitable but still run into trouble if it cannot pay short-term obligations
- good liquidity helps the business pay suppliers, wages and other current liabilities on time
- poor liquidity may cause cash flow stress, missed payments and damage to supplier relationships
- owners and lenders will often watch liquidity closely because it affects day-to-day survival

Liquidity ratios
The main liquidity ratio in this course is the current ratio. It uses figures from the balance sheet, especially current assets and current liabilities.
The current ratio is usually expressed as a ratio, such as 1.5:1.
Current Ratio
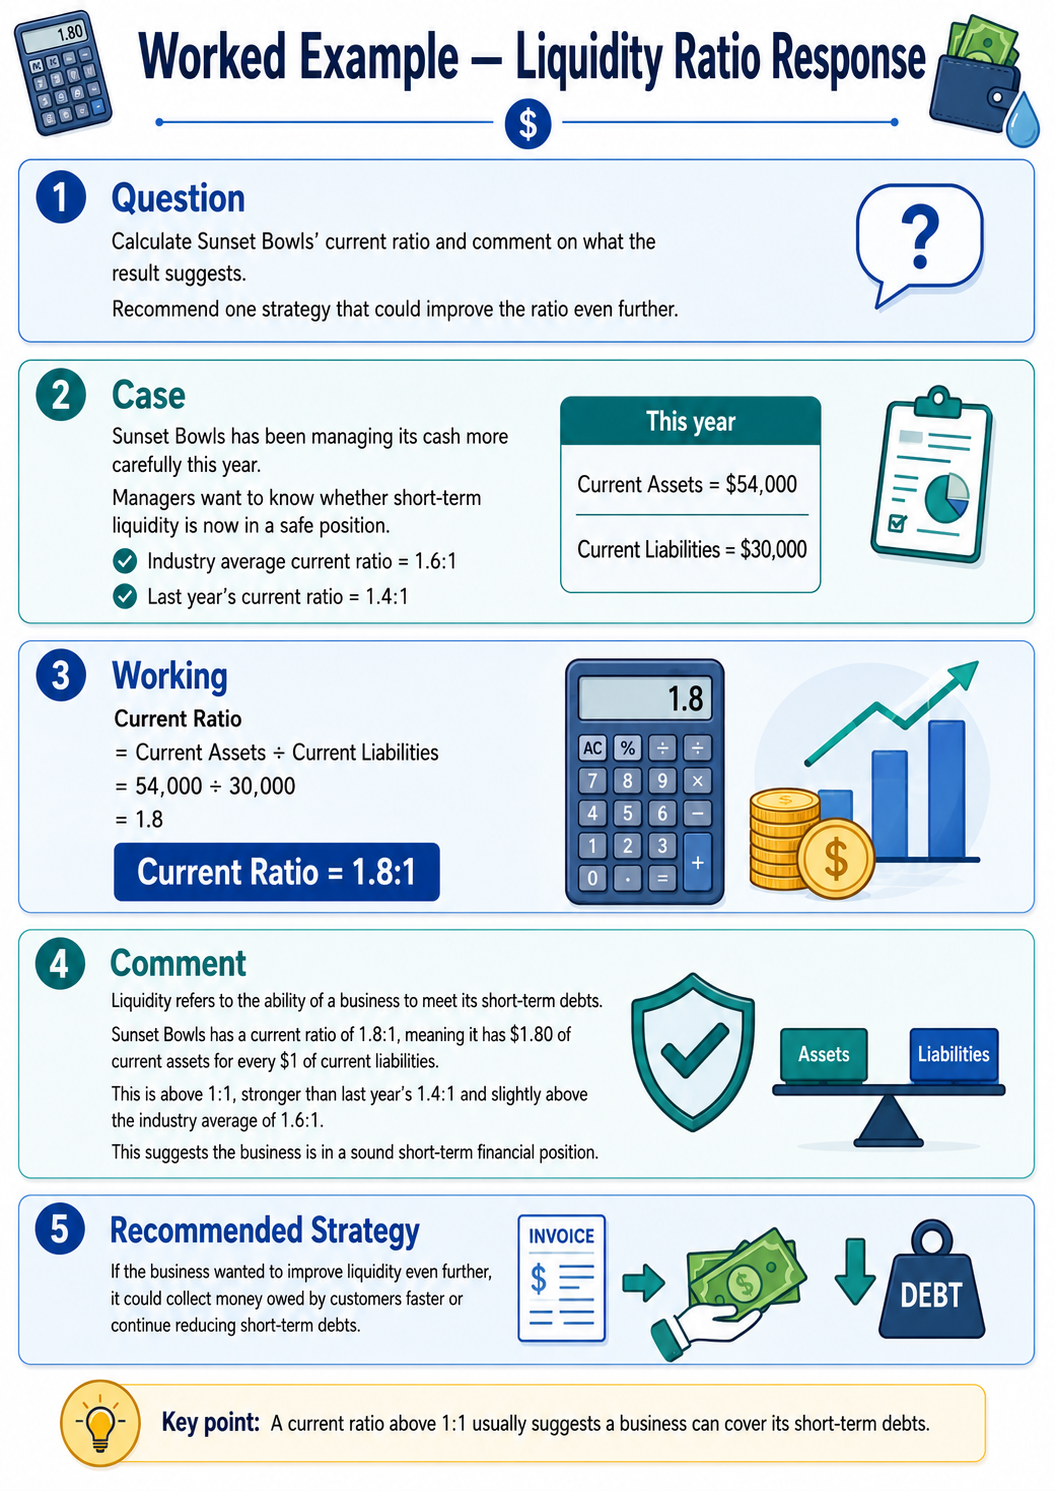
Current ratio
This shows how many dollars of current assets the business has for every $1 of current liabilities.
A higher current ratio usually suggests a stronger ability to cover short-term debts.
How to interpret current ratio
- a ratio above 1:1 usually suggests the business has enough current assets to cover current liabilities
- around 1.5:1 to 2:1 is often seen as reasonably healthy, but industries differ
- below 1:1 may suggest a liquidity problem
- a retail business may need strong liquidity because it often has short-term supplier payments to manage
- best interpreted by comparing with previous years, competitors and the industry average
Strategies to improve liquidity
- collect money owed by customers faster
- increase cash sales
- reduce short-term debts where possible
- sell an unwanted non-current asset, such as old equipment, for cash
- replace some short-term debt with a long-term loan so the short-term pressure is reduced
- reduce the amount of cash tied up in stock by improving stock control
How to comment on a liquidity ratio
- define liquidity as the ability to meet short-term debts
- state the ratio clearly, such as 1.4:1 or 0.9:1
- explain what that means in simple terms
- compare it with last year, a competitor or the industry average
- say whether the business appears to have a liquidity problem or whether it is already in a sound position
- if needed, suggest a strategy to improve it even further
🏦 Stability
Stability shows the long-term financial strength of a business. It helps show whether the business is relying too heavily on debt and whether its financial structure looks safe over time.
Why stability matters
- shows whether the business can handle long-term debt
- helps assess overall financial risk
- is important for lenders, investors and owners
- a business with weak stability may be more vulnerable during hard times or rising interest rates
Stability ratios
The main stability ratio in this course is the debt to equity ratio.
It uses figures from the balance sheet, especially total liabilities and equity.
Debt to Equity Ratio
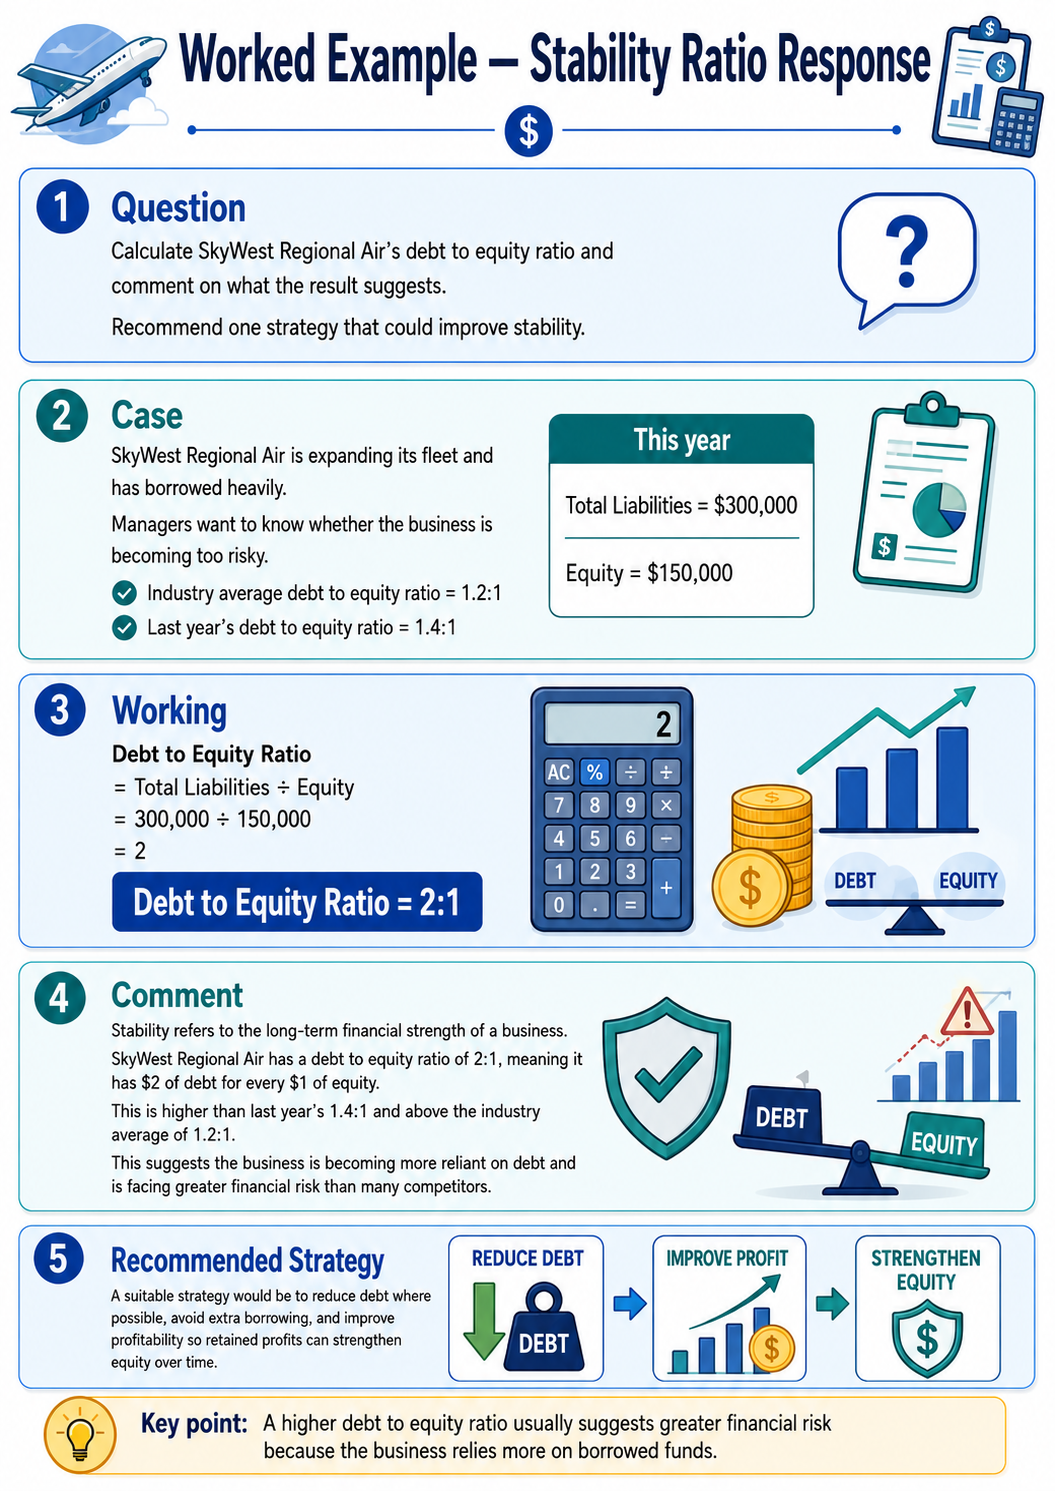
Debt to equity ratio
This shows how much debt the business has compared with the owner’s equity.
A higher ratio usually suggests the business is relying more heavily on borrowed funds, which may increase risk.
How to interpret debt to equity ratio
- below 0.5:1 — usually lower debt and stronger stability
- around 1:1 — more balanced, with debt and equity at similar levels
- above 1.5:1 — higher reliance on debt and greater financial risk
- above 2:1 — often seen as risky, unless the industry normally uses high debt
- some industries such as airlines, mining or property development may naturally carry higher debt because assets are expensive
- best interpreted by comparing with previous years, competitors and industry average
Strategies to improve stability
- pay off some long-term debt
- avoid taking on too much extra borrowing
- increase owner investment or keep more profits in the business
- improve profitability so equity grows over time
- sell unnecessary assets and use the money to reduce debt
- slow down expansion plans if the business is borrowing too heavily to grow
How to comment on a stability ratio
- define stability as long-term financial strength
- state the result clearly
- explain what it means about debt compared with equity
- compare with previous years, competitors or industry average
- say whether the business appears more or less risky and suggest a strategy if needed
📋 Table summary
| Indicator | Meaning | Main ratio / measure | Financial statement needed | How to interpret | Strategies to improve |
|---|---|---|---|---|---|
| Profitability | Ability of the business to make profit from sales. |
|
Profit and Loss Statement |
|
|
| Liquidity | Ability of the business to meet short-term debts. |
|
Balance Sheet |
|
|
| Stability | Long-term financial strength and level of financial risk. |
|
Balance Sheet |
|
|
🎧 Prefer listening?
If you prefer listening to the content in podcast format:
🎥 Prefer watching?
If you prefer watching the content in video format:
Biz Fact: Airlines often have high debt-to-equity ratios because planes are extremely expensive assets.
How to comment on a profitability ratio